3D Tolerance Stack-Up Analysis: Worst-Case vs. RSS and Monte Carlo Simulation
Compare deterministic worst-case methods against statistical Root Sum Squared (RSS) and Monte Carlo models to optimize assembly yield and manufacturing cost.
When designing mechanical assemblies, parts don't exist in isolation. They are stacked, bolted, and mated together. Even if every individual component is machined within its specified limits, the small variations can accumulate—or stack up—leading to assemblies that fail to fit or function correctly.
To prevent this, design engineers perform a tolerance stack-up analysis. The critical decision is choosing the right mathematical model to evaluate this accumulation: the conservative, deterministic Worst-Case method, or statistical models like Root Sum Squared (RSS) and Monte Carlo simulations.
The Deterministic Approach: Worst-Case Analysis
Worst-Case tolerance analysis is the traditional, arithmetic method. It assumes a scenario where every single part in the assembly is manufactured at its absolute extreme limit (either maximum or minimum size) in the direction that causes the worst possible assembly condition.
For a linear stack-up of $n$ independent tolerances ($t_i$), the total Worst-Case assembly tolerance ($T_{WC}$) is simply the sum of all individual tolerances:
$$T_{WC} = \sum_{i=1}^{n} t_i$$
While this method guarantees $100%$ assembly yield (zero defects), it has a severe drawback: it is extremely conservative. As the number of parts ($n$) in the stack increases, the assembly tolerance grows linearly. To keep the assembly fit tight, engineers are forced to specify incredibly tight tolerances on individual parts, driving up tooling and manufacturing costs exponentially.
In reality, the probability of every single component in an assembly being at its absolute limit simultaneously is near zero, assuming a stable, centered manufacturing process.
The Statistical Approach: Root Sum Squared (RSS)
Statistical tolerance analysis assumes that the dimensions of the manufactured parts follow a normal (Gaussian) distribution. In a normal distribution, most parts fall close to the nominal target, and only a tiny fraction are produced near the tolerance limits.
Assuming the manufacturing processes are centered and stable ($3\sigma$ limits), the total assembly tolerance ($T_{RSS}$) is calculated using the Root Sum Squared formula:
$$T_{RSS} = \sqrt{\sum_{i=1}^{n} t_i^2}$$
Because the terms are squared before summing, smaller tolerances have a negligible effect on the total stack, and large tolerances dominate.
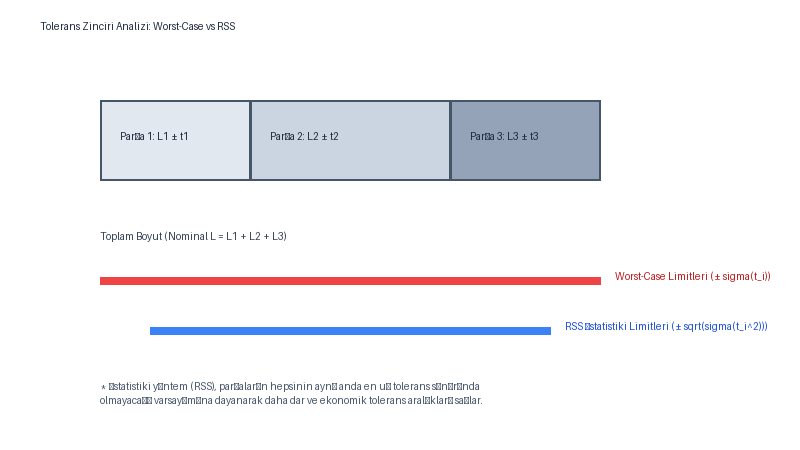
This statistical approach allows engineers to specify significantly wider tolerances on individual parts. For example, in a stack of 5 identical parts with a tolerance of $\pm 0.1$ mm:
- Worst-Case Tolerance: $0.5$ mm
- RSS Tolerance: $\sqrt{5 \cdot 0.1^2} \approx 0.22$ mm
By accepting a tiny, calculated risk of defect (e.g., $0.27%$ scrap rate for a $3\sigma$ stack), the designer can allow wider, cheaper tolerances on the shop floor.
Beyond 1D Stack-Up: 3D Monte Carlo Simulations
While RSS works well for simple, one-dimensional linear assemblies, real-world mechanical systems often feature complex 3D relationships, rotational joints, and non-linear linkages (like a piston engine's crank-slider mechanism).
For these non-linear 3D assemblies, linear summation and RSS are mathematically insufficient. Instead, engineers use Monte Carlo simulations.
A Monte Carlo analysis works by:
- Generating thousands of virtual assemblies using random values for each part dimension, drawn from their specified probability distributions (normal, uniform, or Weibull).
- Calculating the assembly parameter for each virtual build.
- Plotting the distribution of the final assembly dimension to determine the exact yield rate (e.g., how many assemblies out of 100,000 will fail to fit).
This simulation accounts for spatial vectors and angular variations (using small displacement torsors), allowing designers to optimize the assembly yield versus manufacturing cost trade-off with high precision.
Summary Checklist for Tolerance Stack-up Analysis
- Count the parts ($n$): If $n \leq 3$, Worst-Case is simple and safe. If $n > 4$, RSS is almost always necessary to avoid over-tolerancing.
- Evaluate the cost of failure: If assembly failure causes a catastrophic safety hazard or expensive scrap, stick to Worst-Case (or use a high statistical limit like $6\sigma$).
- Verify process capability: RSS and Monte Carlo models assume a controlled manufacturing process. If the supplier's process is unstable or uncentered ($C_p < 1.0$), statistical predictions will fail, and actual defect rates will exceed calculations.
Conclusion
Over-tolerancing is a silent cost driver in manufacturing. By shifting from deterministic Worst-Case models to statistical RSS or Monte Carlo simulations where appropriate, design engineers can dramatically reduce production costs without sacrificing assembly quality.
Sources:
- Creveling, C. M. (1997). Tolerance Design: A Handbook for Developing Optimal Specifications. Addison-Wesley.
- Drake, P. J. (1999). Dimensioning and Tolerancing Handbook. McGraw-Hill.